Edge Analytics Architecture
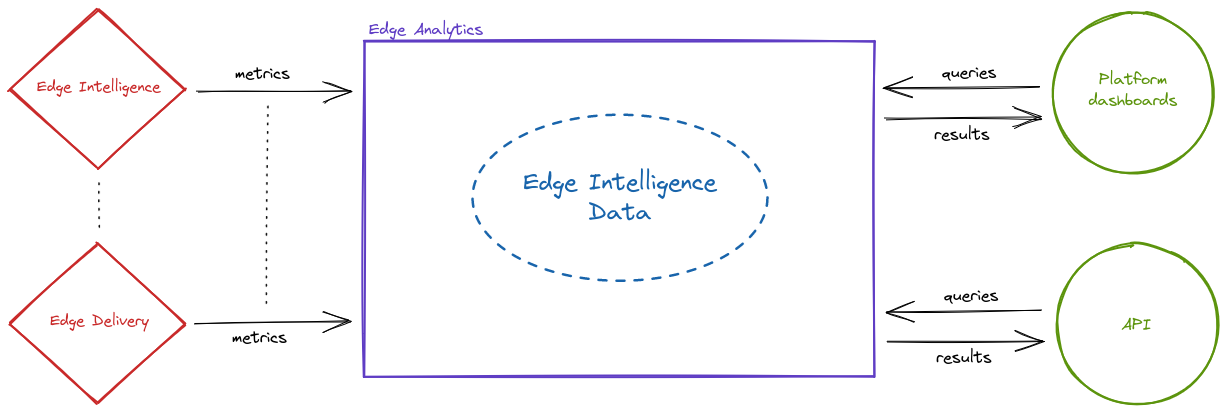
System73's ecosystem of products generates metrics that are to be ingested and stored so these can be visualized on dashboards of System73 Platform or issue queries via API to gain a programmatic access.

Data architecture
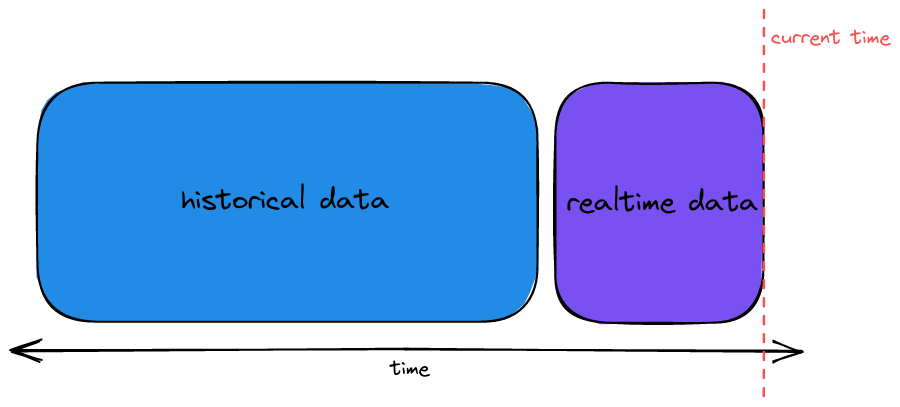
Edge Analytics is designed to provide content delivery metrics with both realtime and historical OLAP queries. Each kind of query targets a specific data layer so basically, there are two main layers: Realtime and Historical.
Like many other databases specifically designed for big data applications, Edge Analytics's database stores data in tables with a large number of columns with denormalized data. Those tables are called datasources and they are central to the implementation of data layers as each data layer maps to a specific datasource.
Each layer has its own capabilities and restrictions to guarantee the same baseline query performance margins across layers.

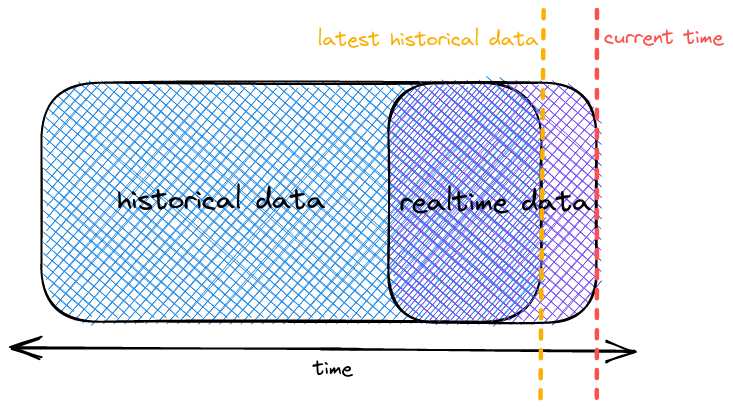
In reality these two layers overlap in terms of time to cover as much data as possible.

Realtime layer
| Finest query granularity | Data retention | Most recent data |
|---|---|---|
| Second | Last 30 days | Within the last 5 seconds |
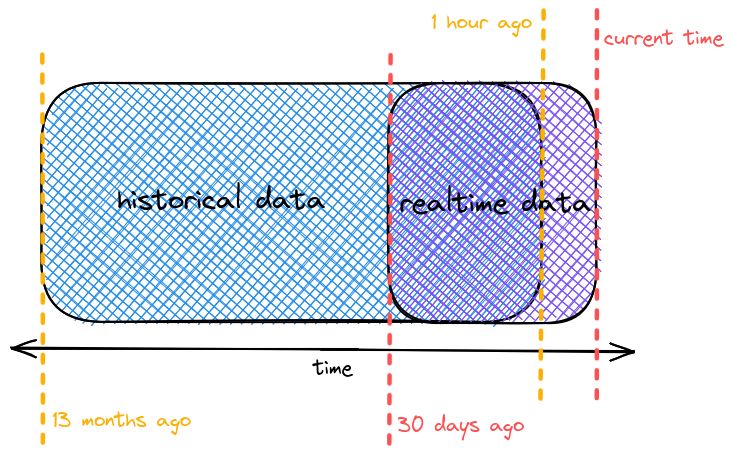
The realtime layer allows queries to obtain the latest live metrics with up to a second resolution/granularity, and it holds the data of the last 30 days. Data is indexed in realtime with a delay of up to 5 seconds.
Historical layer
| Historical sub-layer | Finest query granularity | Data retention | Most recent data |
|---|---|---|---|
| By minute | Minute | Last 13 months | 1 hour ago |
| By hour | Hour | Last 13 months | 1 hour ago |
The historical layers allows for queriers spanning much longer time ranges (up to 13 months) so this layer is subdivided in two layers. Both layers hold the same data, but they differ in the query granularity property.
While executing a historical query that spans 2 months with a minute granularity might be fast, the same query for a larger time range (i.e.: 6 months or more) is going take longer to complete. To compensate for this you can choose to increase the granularity up to an hour against the historical by hour to shorten the query execution time. It is a trade-off between query performance and the combination of query granularity and time range.
The historical layers does not fully overlap with the realtime layer. The most recent data of the historical layers is the last data point from around 1 hour ago. In other words, it holds data from the last 13 months up to 1 hour ago.
The following is the time boundaries (data retention) of the main data layers

Important
Granularities are predefined (e.g: second, minute, hour, day,
week, month, etc...) and you can change them at query time but be aware that the query will
not get results with granularities finer than the query granularity defined for a data layer.
Data model
As mentioned before, datasources are big tables containing denormalized data. Datasources are essentially, composed of three kinds of columns:
-
Timestamp (primary timestamp)
Datasources must always include a primary timestamp because it is used for partition and sorting the data. The column
__timealways contains the data timestamp. -
Dimensions
Dimensions are columns that are stored as-is and can be used for any purpose. You can group, filter, or apply aggregators to dimensions at query time in an ad-hoc manner.
-
Metrics
Metrics are columns that are stored in an aggregated form. Each metric column has defined an aggregation function that is applied when ingesting data and based on the datasource's query granularity. You can apply aggregation functions at query time to metrics columns.
Keep on reading the Data Model section to have a full reference of datasource schemas for Edge Intelligence.
This section was last updated 2025-06-11